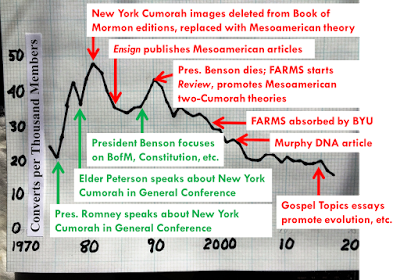
Here’s the graphic. I’ll explain it below.
 |
| Converts per 1,000 members. Graph by David Allan. |
______________________
Most people know that much of the growth of the Church now is in Africa; in fact, nearly 10% of convert baptisms in the Church in 2015 were in the Africa West Area alone (24,409 converts out of 261,862 total throughout the Church).
I think the numbers are higher than 10% because so many “convert” baptisms in the U.S. are children baptized when they are older than 8, as well as part-member families, which legitimately count, but are not “converts” in the sense that we usually think; i.e., people coming from another religious tradition.
The Africa West Area consists of Sierra Leone, Liberia, Cote d’Ivoire, Ghana, Togo, Benin, and Nigeria, where total Church membership is only around 270,000. This means the Africa West Area had a conversion rate of about 90 converts per 1,000 members.
Overall in the Church, the conversion rate is about 16 per 1,000 members. (261,862/15,900,000)
Other areas in Africa have comparable conversion rates to the Africa West Area. In 2016, 100 stakes were created. 40 were in the U.S., 21 in Africa, 7 in Central America, and 11 in South America. 16 of the 30 new districts were also in Africa. These statistics show that because Africa has relatively few members, the conversion rate per 1,000 members is far higher than elsewhere in the world, looking at regions or areas.
In 2017, 33 new stakes have been created, with a projection of 20 more to be created. 26 are in Africa, 8 are in Central America, 4 in the Philippines, 11 in the U.S., 2 in South America, 1 in Canada, which reflects relative growth in those areas.
This means the conversion rate outside of Africa is well below 16/1,000.
Here’s a graphic depicting the trends. Note that converts in Africa didn’t increase significantly until around the year 2000. The graphic would depict a much steeper decline if not for Africa.
 |
| Chart prepared by David Allan |
It would be interesting to see this chart on a regional or Area basis, but that information is not publicly available. No doubt, there is considerable variation among the various Areas. You can read about trends and statistics here: http://cumorah.com/
The statistics on converts per missionary reflect similar trends.
 |
| # conversions per missionary from https://www.timesandseasons.org/index.php/2016/04/converts-per-missionary/ |
 |
| # convert baptisms from https://www.timesandseasons.org/index.php/2016/04/converts-per-missionary/ |
We can think of as many explanations for these trends as we want, and every ward, stake and Area has unique circumstances, but I’d like to point to an interesting development. Of course, correlation is not causation, but in this case, I think there are significant elements of causation.
Source: Book of Mormon Wars
